Meltwater Test
This article will help you use Explore search options to monitor your brand, organization, competitors, campaigns, or industry topics. It walks you through the process of creating and managing your searches within Explore.
This article will cover:
What is Explore?
Explore is Meltwater's media monitoring hub, where you search, analyze, and report on any topic — your brand, competitors, campaigns, or industry — across news, social, and broadcast sources.
What you can do in Explore:
- Monitor brand mentions and sentiment in real time
- Track competitors and industry conversations
- Research topics before campaigns or announcements
- Build saved searches that power alerts, dashboards, and reports
- Identify and vet journalists and influencers covering your topics
How to access: Select Explore from the left-hand navigation bar.
| Subscription note: The number of saved searches available to you depends on your Meltwater subscription. Ad hoc searches are unlimited on all plans. |
Key concepts
- Saved Search A search you have named and stored so you can reuse it. Saved searches persist in your Explore tab until deleted and can be connected to Smart Alerts, Monitor, and Dashboards.
-
Ad hoc search A one-time search run without saving. Useful for quick research. Not available in alerts or dashboards.
- Boolean The query language Meltwater uses to define search logic. Uses operators like AND, OR, and NOT to include or exclude results precisely. Required for Advanced Search; optional in Keyword Search.
- Filter A parameter applied on top of your search query to narrow results — by source type, language, location, sentiment, or keyword. Filters do not change your saved query, only the current view.
- Filter Set A saved combination of filters you can apply to any search in one click. Useful when you regularly monitor the same region, language, or source type.
- Custom Category A saved sub-filter built from a Boolean query. Used to consistently exclude irrelevant sources or isolate a specific segment — such as a list of competitors — across multiple searches.
- Entity Analysis Sentiment analysis at the entity level. Measures tone toward a specific brand or person mentioned in an article, independent of the article's overall sentiment.
Search Options
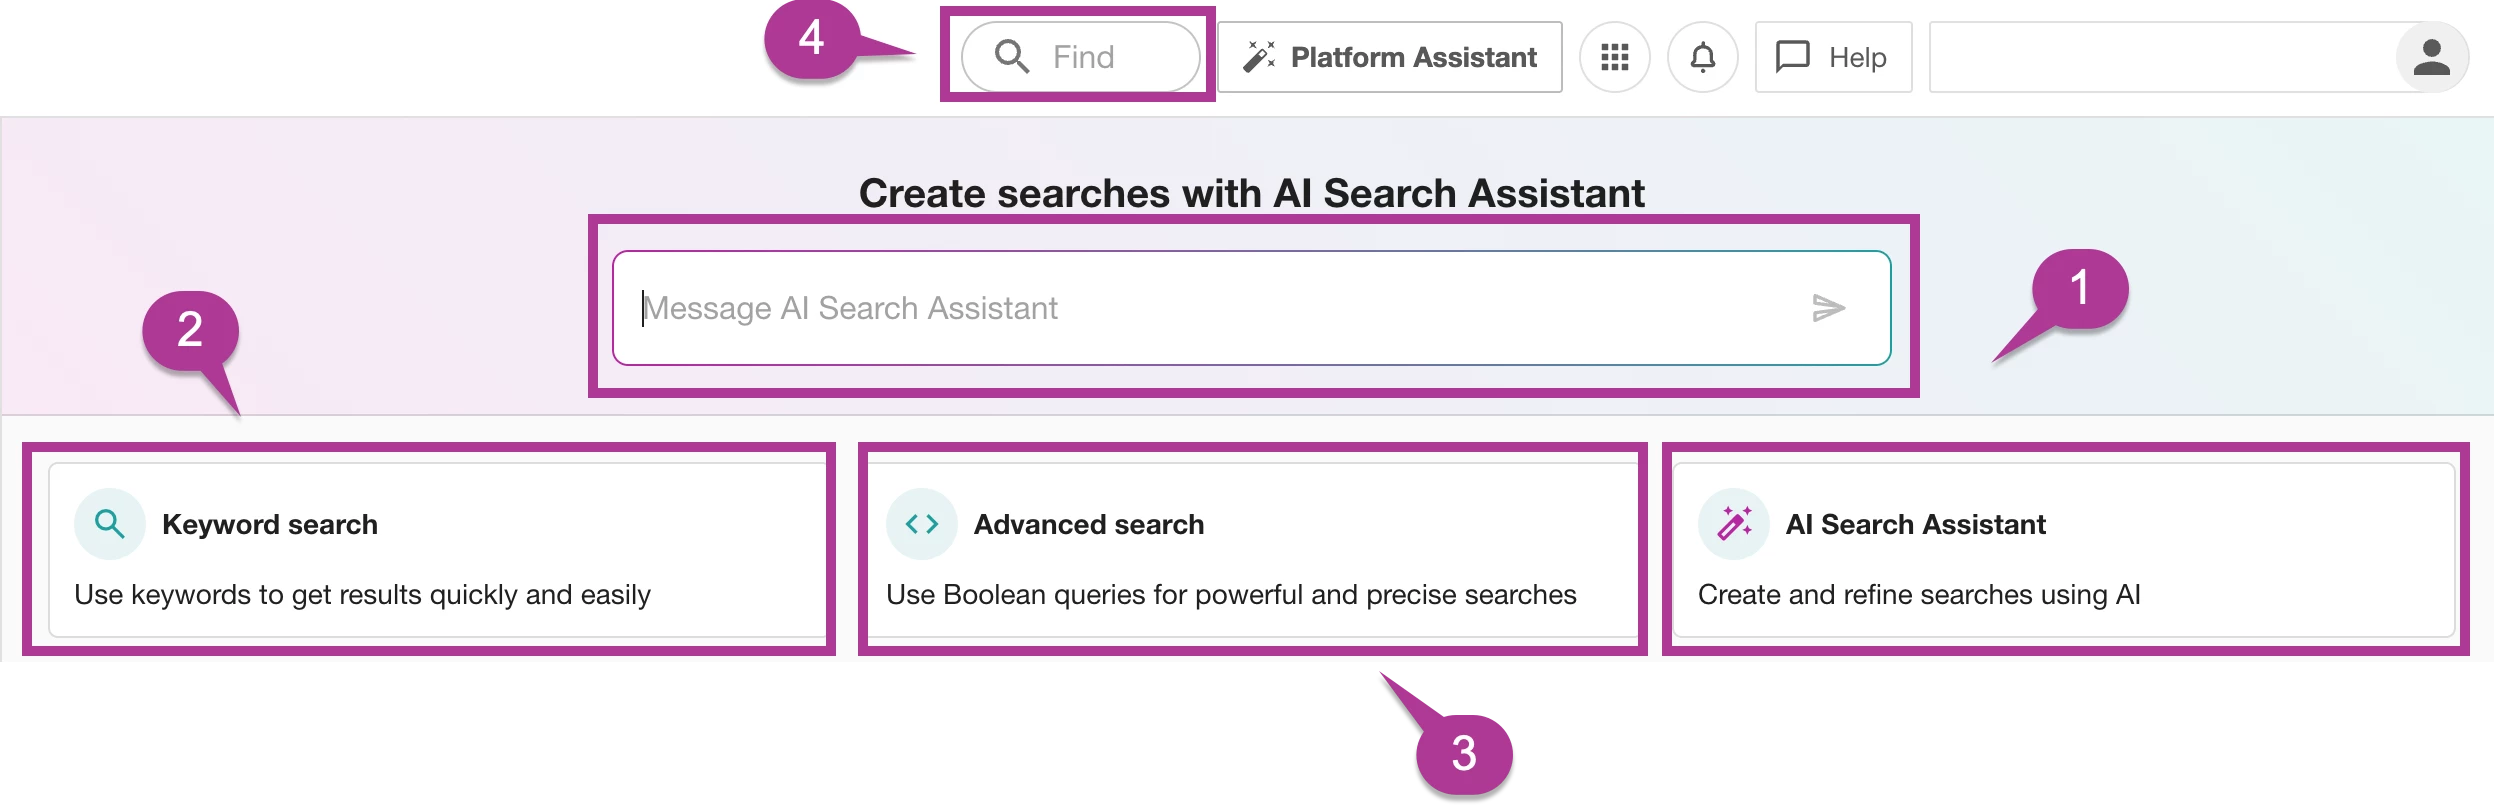
Once in Explore, you can select the type of search you wish to run. You will have four options to create a search in Boolean:
-
AI Search Assistant: Leverage the AI chatbot's deep understanding of the Meltwater Boolean language and streamline the search query writing process. Learn more about the AI Search Assistant.
-
Keyword Search: Enter terms or phrases into the input boxes (All of these, At least one, and None of these). Our system will then create the search for you. This option is recommended for simple searches or for new users of the platform.
-
All of these - this will only show results when ALL of the keywords entered are mentioned in the media.
-
At least one - this will show results where at least one of the keywords entered are mentioned in the articles/posts.
-
None of these - This will remove any results that mention ANY of the terms entered. This is helpful if you notice a lot of irrelevant results (e.g., when searching for Meltwater, we have to add "Iceberg" to this box to remove global warming results)
Note: Keywords can include but are not limited to, your brand name, an industry topic, a product name, and names of key stakeholders or leadership.
-
-
Advanced Search: Create a Boolean query using AND, OR, NOT, and other operators for more precise search results. (see our complete list of Boolean operators) This is best for advanced users familiar with Boolean operators.
-
Find: Use this search bar to create a Company Entity Search. Learn more about Company Entity Searches.
Once you select the type of search you want, you will be able to enter your keywords or Boolean to create your search. Let’s look at how to do this next.
Creating a Search
There are three ways to create a search:
- Keyword Search
- Advanced Search
- Using the AI Search Assistant (recommended for beginners)
Keyword Search
-
Click Explore in the left-hand navigation bar
-
Select Keyword Search
-
Use the three Keyword boxes to specify the words you want to include/exclude from your search
-
All of these - this will then only show results when the company AND ALL the keywords entered are mentioned in the media.
-
At least one - this will then show results where the company and at least one of the keywords entered are mentioned in the articles/posts.
-
None of these - This will remove any results that mention ANY of the terms entered. This is helpful if you notice a lot of irrelevant results (e.g., when searching for Meltwater, we have to add "Iceberg" to this box to remove global warming results)
-
-
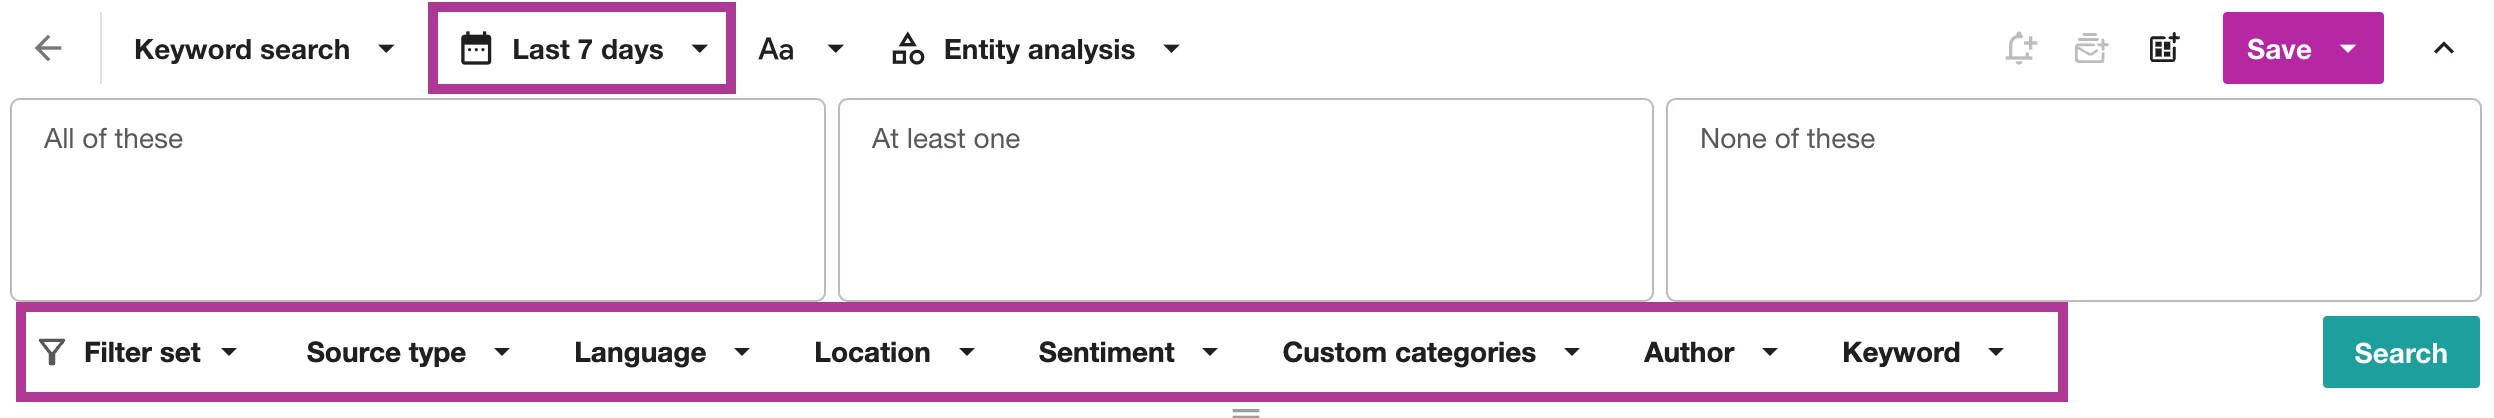
Adjust the Date Range and apply Search Filters to broaden or narrow your results. Learn more about Using Filters to Improve Search Results.
-
Click Search to run the search so you can review the content returned by your keywords. If there are irrelevant results, add keywords to the None of these box to further refine the results
-
Click the Save drop-down in the top right-hand corner to save the search so you can use it again (e.g. to run it again in Explore, to create Smart Alerts, etc.)
-
Click Save as for a new search (you can edit a search after it’s been saved.
-
Enter a Name for the search and add it to a Label (optional).
-
Click Save to finish saving your search.
Keyboard Navigations available in a Keyword Search:
-
Tab on the keyboard to move left to right between boxes
-
Shift+Tab to move right to left
-
Use arrow keys to shift through dropdown options (i.e. company search)
-
Delete inputs with backspace
Mouse Interaction available in a Keyword Search:
-
Drag and drop inputs between boxes
-
Inputs have 'remove' as an immediate action
Advanced Search
To build an advanced search, you will need to understand the Boolean search format. We offer Meltwater Academy courses and resources that will help you learn this. Think of Boolean as the grammar of your search. Just like sentences have structure, so should your queries. With Boolean, you can use terms like AND, OR, and NOT to make your searches smart and (very) specific.
Advanced Editor
The Advanced Boolean Editor in Explore makes it easier to work with complex Boolean queries by highlighting keywords like operators, numbers, strings, and parentheses. It also organizes your query into separate lines for better readability and editing.
-
Blue: Boolean operators (AND, OR, NOT)
-
Green: Phrases in “quotation marks”
-
Black: Words/phrases not in parentheses appear
-
Red: Colons: Advanced Operators
-
Red squiggles: appear below errors

Using the AI Search Assistant
Alternatively to creating an Explore search from a Keyword or Advances Search, you can use the AI Search Assistant. The AI Search Assistant makes it easier for users of all experience levels to create high-quality search queries—faster and with less effort. This leads to more accurate results and frees up time for data-driven decision-making. Learn more about the AI Search Assistant.
Data Sources in Explore
Explore includes a variety of data sources across News, Social Media, and Broadcast. The specific source types available in your Meltwater account may vary based on your subscription.
To find out which source types are included in your account, just ask Mira Companion:
“What are the source types included in my account?”
For a full overview of data sources in Explore, visit: https://community.meltwater.com/source-types-137
Possible Data Errors
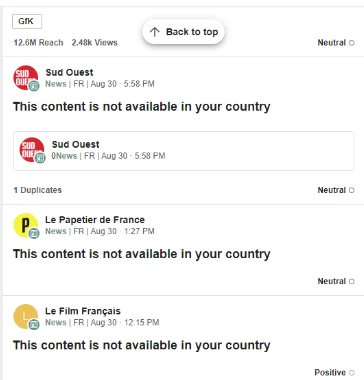
Content Not Available in Your Country
There may be instances when you encounter the message "This content is not available in your country." This means the content you're trying to access is restricted or blocked based on your geographic location. This can occur due to licensing agreements, copyright restrictions, or other regulatory limitations that prevent certain materials from being distributed or viewed in specific regions.
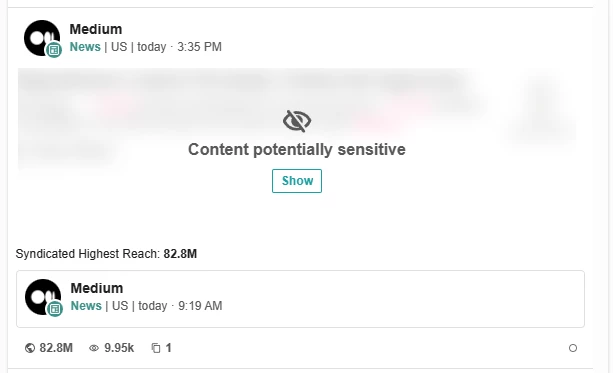
Sensitive Content
Possibly Sensitive Content warns you if the content populating in your searches might not be suitable. This content can be automatically blurred. To expose the content, click Show or click the article. To opt out of this, please contact your Meltwater contact.
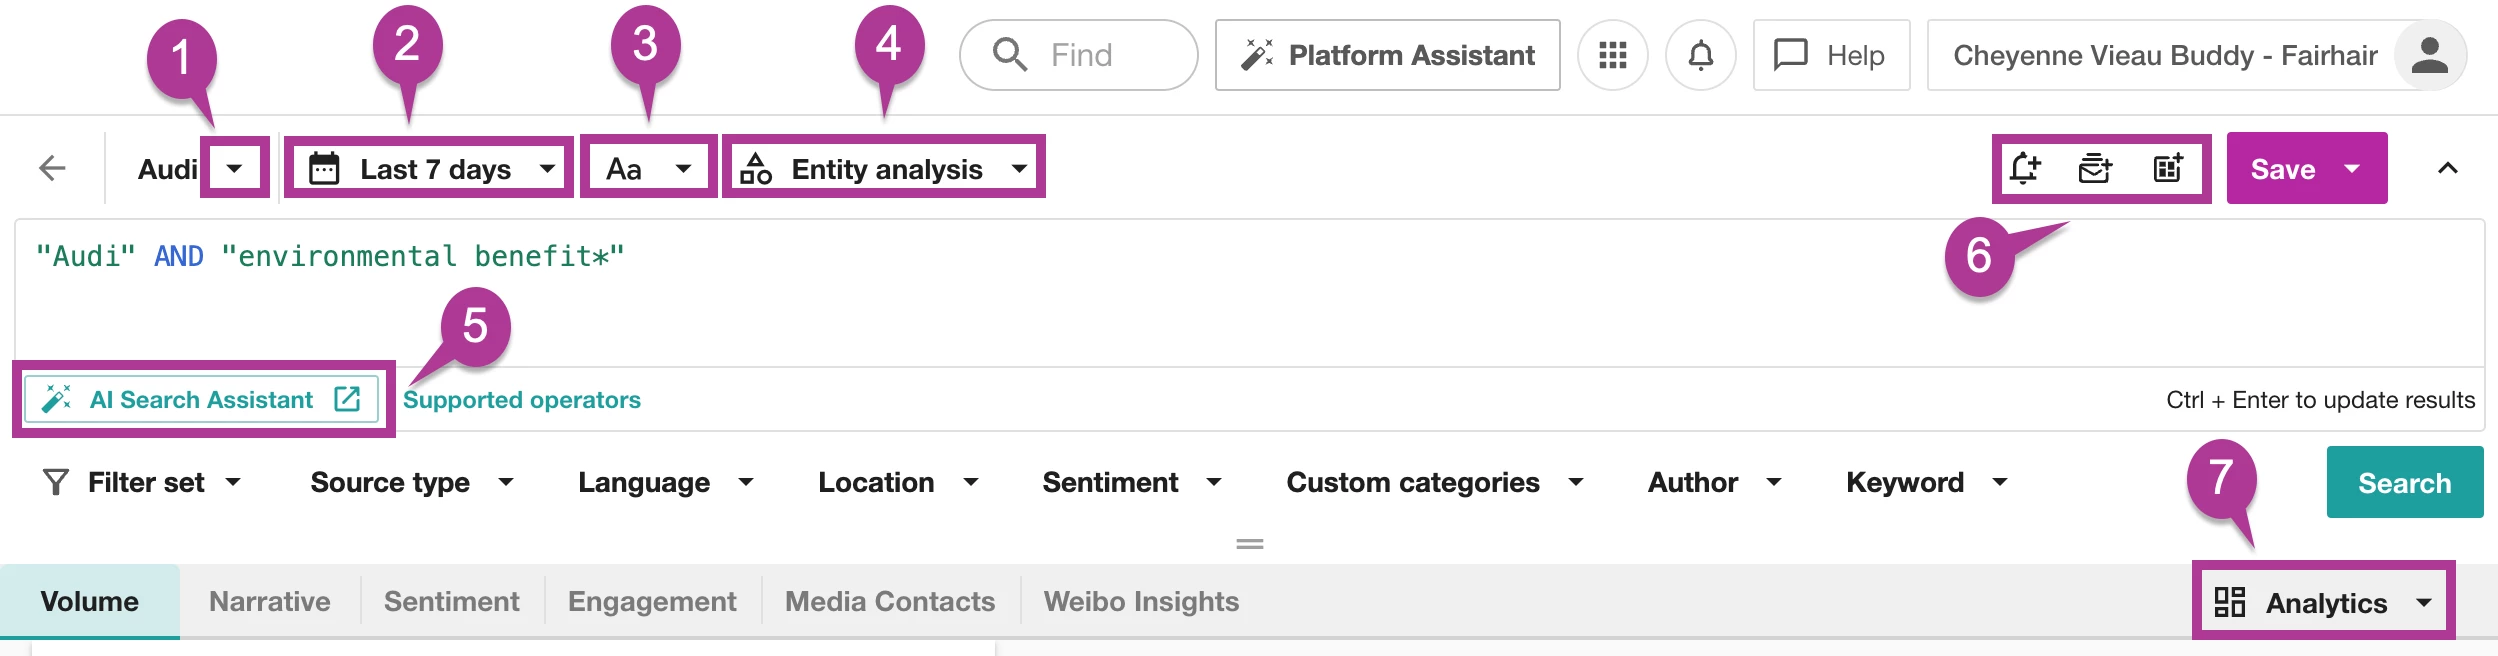
Actions Within an Explore Search
Within your Explore search, you will find a number of actions.
-
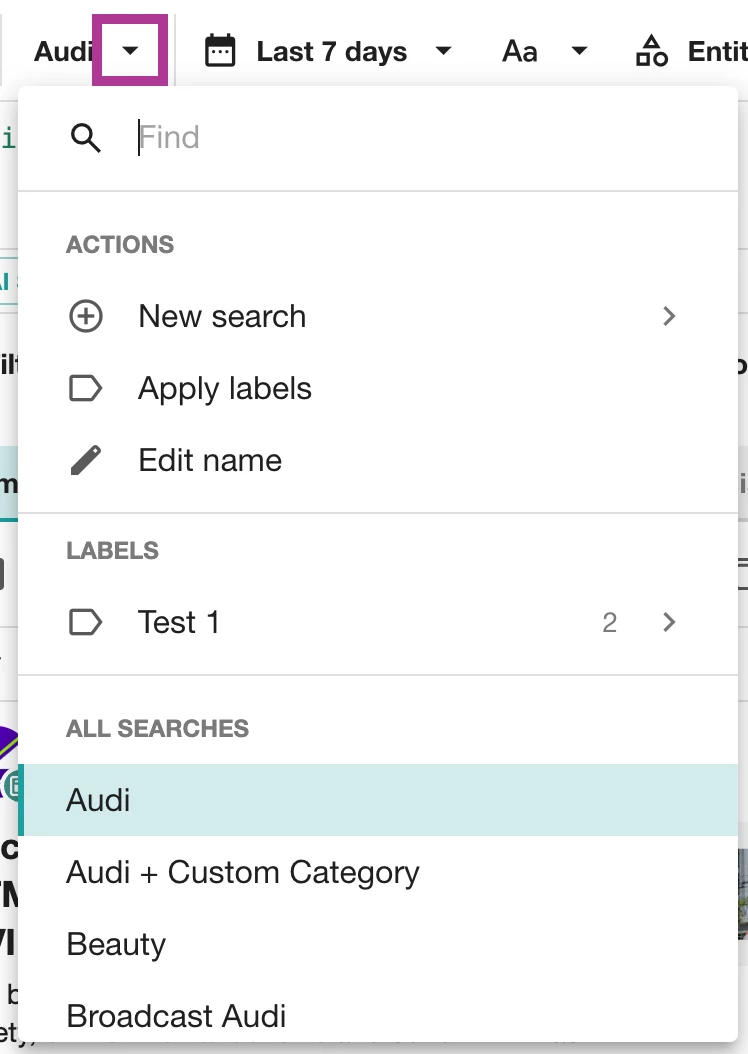
Search Name drop-down: within this drop-down are several additional search options
-
New search: after clicking on the arrow, you can choose between three options:
-
Keyword Search: Enter terms or phrases into the input boxes (All of these, At least one, and None of these). Our system will then create the search for you. This option is recommended for simple searches or for new users of the platform.
-
Advanced Search: Create a Boolean query using AND, OR, NOT, and other operators for more precise search results. (see our complete list of Boolean operators) This is best for advanced users familiar with Boolean syntax.
-
Combined Search: Combined Searches allows you to quickly combine your existing saved searches, filter sets, and custom categories into a new search.
-
-
Apply labels: Add the opened search to an existing or new label. Learn more about Using Labels in Explore.
-
Edit name: Rename the opened search. Click Save after any changes.
-
Labels: Take a look at the labels you have already created.
-
All Searches: Better understand your current saved searches in Explore. Click into any other search directly from this view.
-
-
Date Range: Adjust the date range to better reflect the results you want to drill into. There are pre-saved date ranges, or you can create a custom date range.
-
Case Sensitivity: Select the distinction between uppercase and lowercase letters in your search terms.
-
Off: Match all letter case variations in search terms
-
Match Case: Match exact case in search terms
-
Hybrid: Match only capital letters used in search terms
-
-
Entity Analysis: Entity-level sentiment captures the tone toward an entity, independent of the document's overall sentiment. Your preference will be saved with the search.
-
AI Search Assistant: The AI Search Assistant simplifies the search query writing process for users of all levels, writing high-quality searches faster and with less hassle, leading to more accurate results and time for making data-driven decisions.
-
Alerts and Dashboards: Create an alert, digest report, or report using the opened search directly from this view.
-
Analytics: Toggle between Classic Analytics and Brand Analytics for different views and metrics based on your search results.
Switching Between Saved Searches
Once you've created saved searches, Explore lets you quickly switch between them without going back to your library. This is especially helpful when working with different search types—Keyword, Advanced, Combined, and Compare—for a more seamless workflow.
To switch between searches:
-
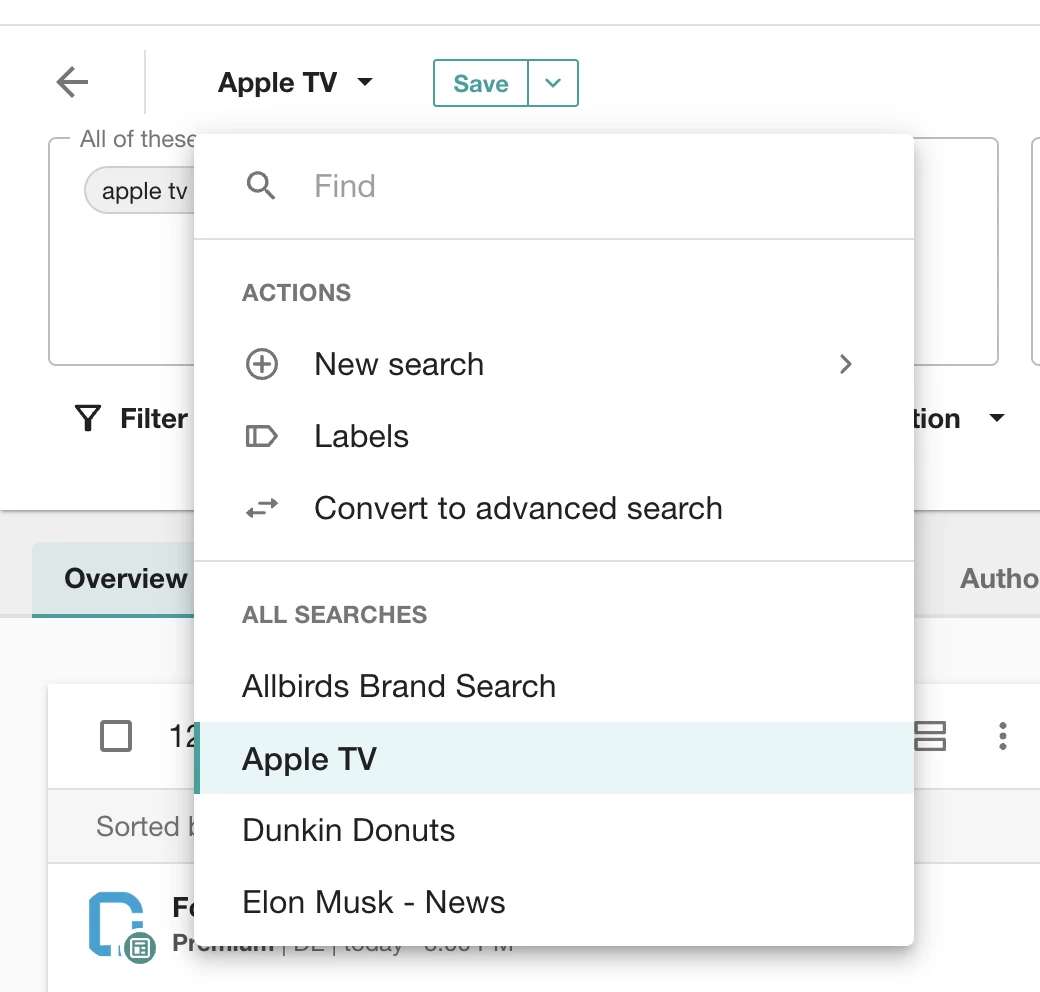
From the Explore results page, click on the top-left drop-down box:

-
All of your saved searches and labels will be displayed

-
Select one of your saved searches, and it will load results in Explore. This is available for Keyword, Advanced, Combined, or Compare searches.
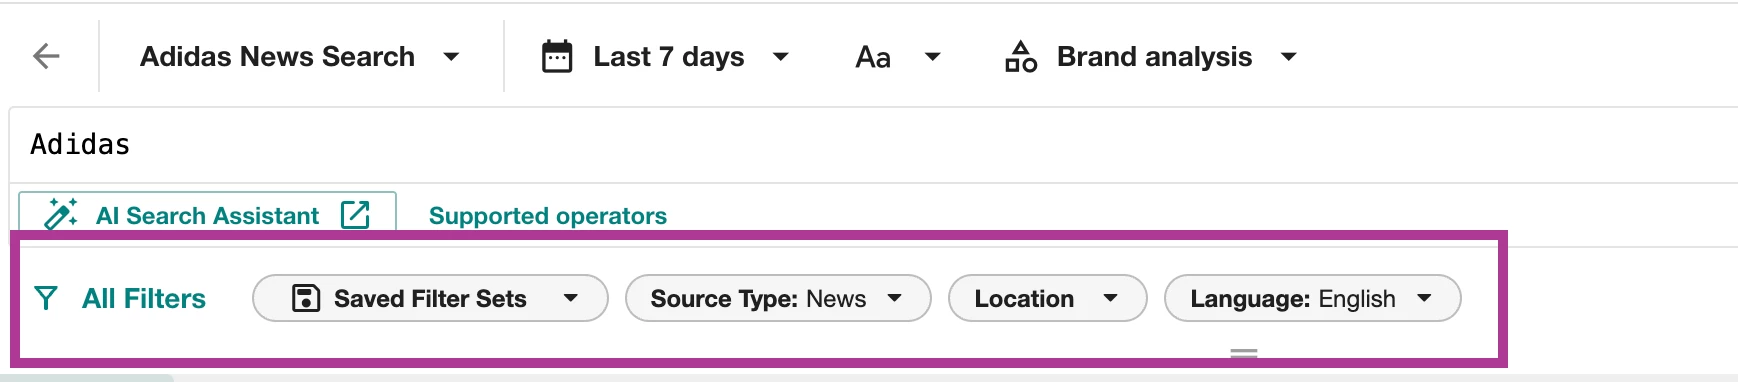
Using Filters to Improve Search Results
When running a search, you might encounter an overwhelming number of results if only broad query terms are used. To avoid sifting through irrelevant results, it's essential to apply filters. Filters help narrow search results, allowing you to focus on the most relevant documents and articles.
Filters are available directly under the search entry box.
Let’s break down each filter below:
Filter Sets
You can save commonly used filters for quick access. This could include filters for specific locations, languages, or editorial sources.
To apply filter sets:
-
Click Explore in the left-hand navigation bar
-
Click on the saved search you want to add this filter to
-
Select the filters you wish to apply
-
Click the Filter set drop-down
-
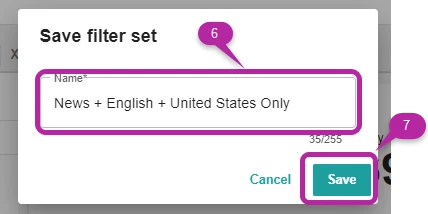
Click Save
-
Give your new filter set a name
-
Select Save
-
The filter set will now be available in the Filter set dropdown list below the Quick Picks. Simply open the Filter set drop-down, click on the saved filter set and all its filters will automatically be selected.
Source Type
This filter allows you to restrict content to specific sources like News, Social, or Broadcast.
To apply a source type filter:
-
Click Explore in the left-hand navigation bar
-
Click on the saved search you want to add this filter to
-
Select the Source Type drop-down
-
Check the box next to the source type(s) you want to include in your search.
-
Click Apply to reload your results to include the selected source types
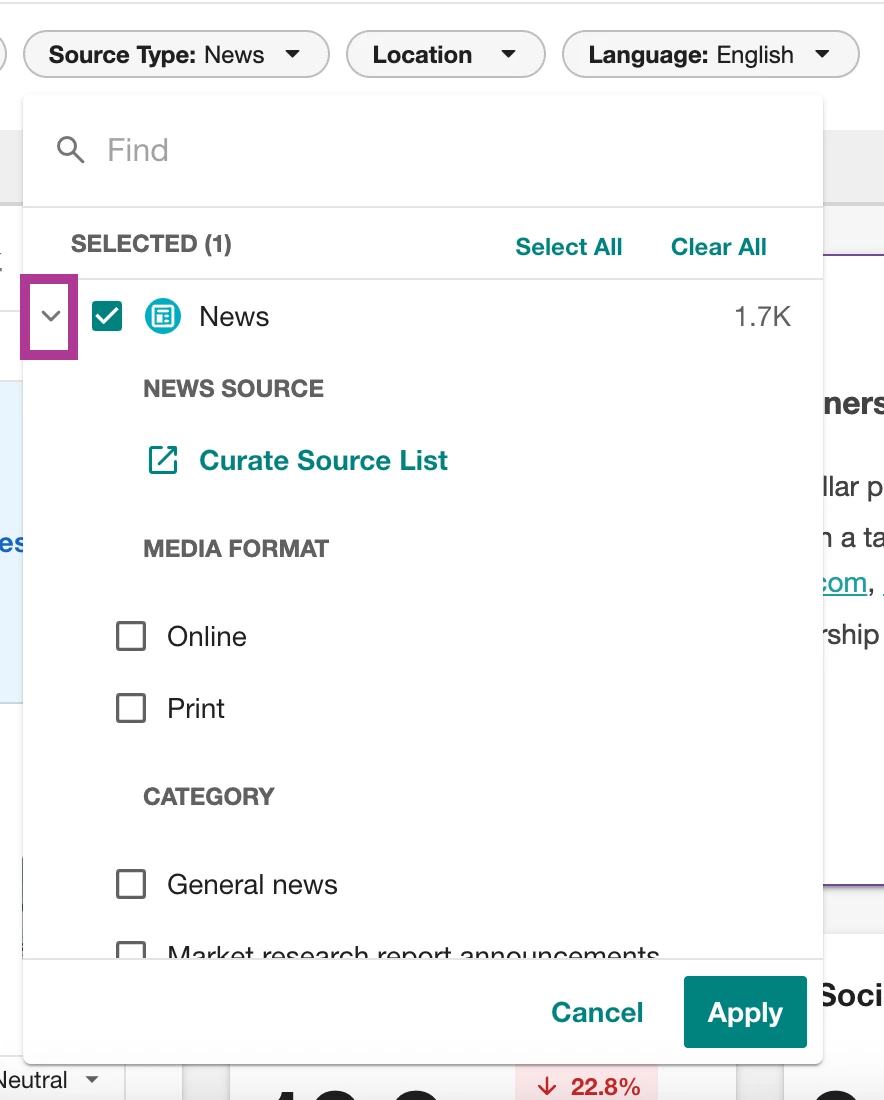
Source types like News and RSS let you drill down further. You can find their corresponding sub-filters by following these steps:
-
Select the arrow next to any source type
-
Type a News source name or website into the search box
-
Click Enter on your keyboard
-
A list of sources with checkboxes matching your entry will appear
-
Check the boxes for the sources you would like to include in your search results
-
Click Apply
To sub-filter RSS, you check the boxes next to the individual RSS feed(s) set up in your account. Learn more about Adding an Incoming RSS Feed.
Language
Select one or more languages to narrow your results to content in just those languages.
To apply a Language filter:
-
Click Explore in the left-hand navigation bar
-
Click on the saved search you want to add this filter to
-
Select Language drop-down
-
Check the box next to any language you want to include
-
Click Apply
Location
Filter by country, state/province, or city for precise location-based results. You can also select “Unknown” to return results without specific location information, like blogs and forums.
This is the location of the source or outlet itself, not the location of its audience.
To apply a Location filter:
-
Click Explore in the left-hand navigation bar
-
Click on the saved search you want to add this filter to
-
Select Location drop-down
-
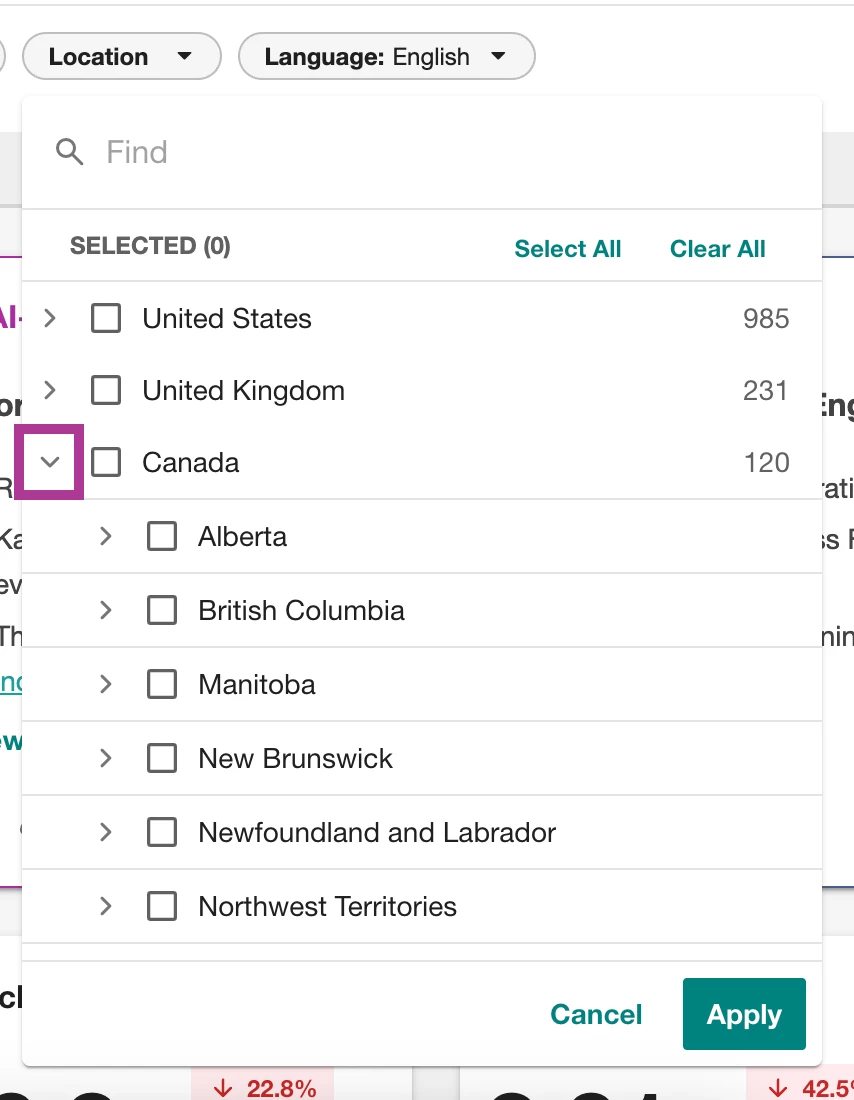
Check the boxes next to the specific country or set of countries you want to filter.
-
Click Apply
-
The arrow to the left of the country item will open a list of provinces and states in that country. You may also drill a level deeper into the cities in the selected state/province, again by clicking on the arrow to the right.
Note: Location data is now available for Instagram content in Explore results. Location data is AI-based, using post-level data, such as hashtags, language, user bio, etc., to infer the country/location of the person/handle. Not all Instagram content will include location data. This is due to privacy settings and other limitations on Instagram.
Sentiment
Segment your results by Positive, Negative, Neutral, or Not Rated sentiments.
To apply a Sentiment filter:
-
Click Explore in the left-hand navigation bar
-
Click on the saved search you want to add this filter to
-
Click All Filters
-
Select Sentiment
-
Check one or more sentiment values you want to use to filter results.
-
Click Apply
Custom Categories
Custom Categories allow you to save searches that you frequently use to sub-filter other searches, saving you time and effort. You can use custom categories to exclude sources or terms that are irrelevant to your results or save a set of competitors you research, etc.
You will first need to set up and save a Custom Category filter to make it available for all searches.
Now that you have at least one Custom Category created - in order to apply the filter:
-
Click Explore in the left-hand navigation bar
-
Click on the saved search you want to add this filter to
-
Click All Filters
-
Select Custom Categories
-
Check one or more categories you would like to use to filter results
-
Click Apply
Note:
-
You must first save a Custom Category filter to make it available
-
Custom Categories can include any boolean operators
-
When applying multiple Custom Categories, they are joined as OR statements - in other words, you will get results that match ANY ONE of the custom categories you selected
Author Lists
Filter by specific X handles or Reddit users to monitor content from certain influencers.
In order to use the Author filter for the first time, you will need to create an author list.
Now that you have an author list(s) to apply an Author Filter:
-
Click Explore in the left-hand navigation bar
-
Click on the saved search you want to add this filter to
-
Click All Filters
-
Select Author Lists
-
Check the Author list(s) you would like to use to filter results
-
Click Apply
Tags
-
Click Explore in the left-hand navigation bar
-
Click on the saved search you want to add this filter to
-
Click All Filters
-
Select Tags
-
Check the Tag(s) you would like to use to filter results
-
Click Apply
Learn more about Tagging Content in Explore.
Media Lists
-
Click Explore in the left-hand navigation bar
-
Click on the saved search you want to add this filter to
-
Click All Filters
-
Select Media Lists
-
Check the Media List(s) you would like to use to filter results
-
Click Apply
Learn more about Media Lists.
Owned Accounts
-
Click Explore in the left-hand navigation bar
-
Click on the saved search you want to add this filter to
-
Click All Filters
-
Select Owned Accounts
-
Check the Owned Account(s) you would like to use to filter results
-
Click Apply
Post Type
When analyzing owned Facebook content, paid posts can create significant outliers in engagement and reach metrics. Without a way to separate boosted from organic content, it is difficult to know whether strong performance was driven by ad spend or genuine audience interest.
The Boosted filter makes it easy to answer that question directly — filter in boosted posts to measure campaign impact, or filter them out to assess organic performance cleanly. It also supports clearer earned versus paid reporting.
-
Click Explore in the left-hand navigation bar
-
Click on the saved search you want to add this filter to
-
Click All Filters
-
Select Post Type
-
Check the Post Type you would like to use to filter results
-
Click Apply
Keyword & Emojis
When you add a keyword or phrase to this filter, it gets included in your search. This is especially useful after loading a saved search. You can add more keywords to see how they affect the results without altering your original search. Feel free to repeat this process to include several keywords or phrases.
To apply a Keyword filter:
-
Click Explore in the left-hand navigation bar
-
Click on the saved search you want to add this filter to
-
Click All Filters
-
Select Keyword & Emoji
-
Enter the keyword
-
Click Enter on your keyboard
-
Click Apply
Reputation Categories
-
Click Explore in the left-hand navigation bar
-
Click on the saved search you want to add this filter to
-
Click All Filters
-
Select Reputation Categories
-
Check the Reputation Categories you would like to use to filter results
-
Click Apply
Topics
Building accurate boolean queries takes time and expertise. Users who want to quickly segment conversations by topic — whether for a campaign brief, a competitive report, or a client presentation — often have to either wait for a specialist or work with imprecise results.
Topic Filters remove that barrier. Predefined topics mean any user can instantly explore and segment conversations without writing a single line of boolean syntax.
-
Click Explore in the left-hand navigation bar
-
Click on the saved search you want to add this filter to
-
Click All Filters
-
Select Topics
-
Check the Topics you would like to use to filter results
-
Click Apply
Formatting the Explore Results Page
You are able to tailor the layout of your Explore page in three different ways:
-
Content and analytics
-
Content ONLY
-
Analytics ONLY
To change the layout of the page:
-
Select View
-
Select one of the options

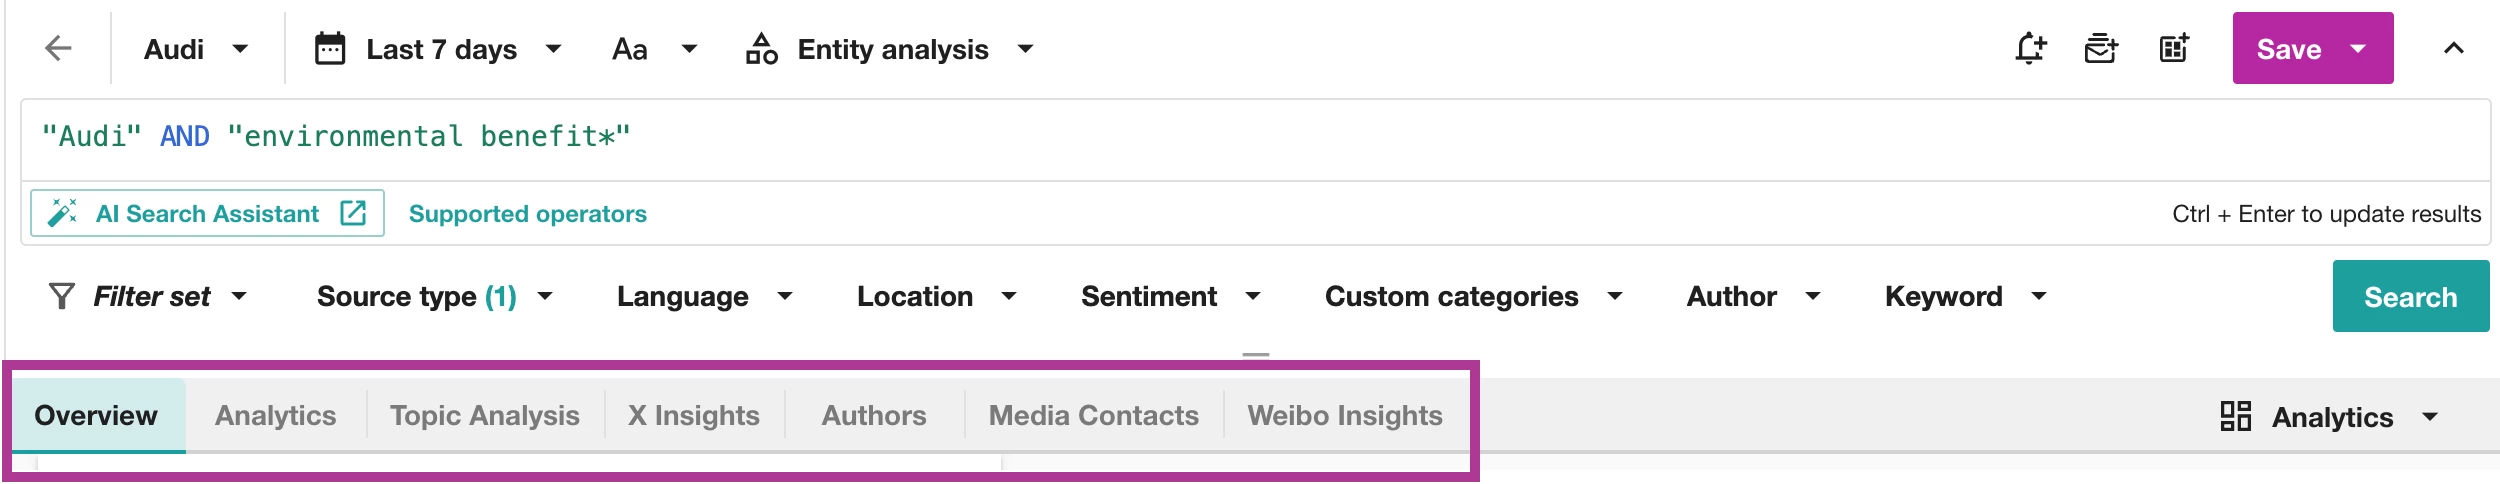
Additional Tab Section
Below the Filters set section, you will notice a section containing a number of tabs. These tabs provide you with further insights into the media coverage for your search.
Note: If you have switched to Brand Analytics from Classic Analytics in the Analytics drop-down, these tabs will be different. Learn more about Brand Analytics.
Let's break down each tab in Classic Analytics below:
Overview
This tab presents a general overview of your search results through a number of charts and tables.
Analytics
Dive deeper into your social media data with the Analytics tab. It helps visualize your data for better understanding. The focus of the Analytics tab is to show the volume of results broken down in a number of ways (e.g. by source such as top forums, by most shared links, etc.)
Topic Analysis
Go beyond just the volume and location of results with the Topic Analysis tab. This tab will provide deeper context about the themes and drivers behind the conversations.
X (formerly Twitter) Insights
Get a focused view of your X data using the X Insights tab. This tab breaks down your X results for a more detailed analysis.
Authors
Discover the 'who' behind the conversations. This tab not only lists the top influencers but also reveals demographics, top professions, and interests of those discussing relevant topics and companies.
Media Contacts
The Media Contacts tab in Explore helps you access profiles of journalists writing articles matching your query results! Easily identify, vet, organize and save lists of journalists that are most engaged about your topics.
Note: Only Meltwater Media Relations customers will see the Media Contacts tab in Explore.
Weibo Insights
Weibo Insights helps you identify and analyze topics exclusively happening on Sina Weibo. Discover new conversation topics, better understand your audience, and make informed decisions about your marketing strategy in China.
Sharing
Now that your Explore search has returned the results you are looking for, there are a few ways to share this content with others.
Selecting Specific Articles
-
Click the checkboxes to the left of one or more articles or posts
-
They can be shared via:
-
Email
-
Select who the email will be from
-
Enter recipients
-
Add a subject
-
Enter a description as the body of the email
-
Click Send
-
-
Exporting the content to a CSV file (to open in Excel or Sheets) or to a PDF file.
-

Sharable Dashboards
To create a Shareable Dashboard, follow these steps:
- Click Explore in the left-hand navigation bar
- Create a new search or open an existing one
- Select the Analytics drop-down on the right-hand side of your screen
- Click Brand Analytics
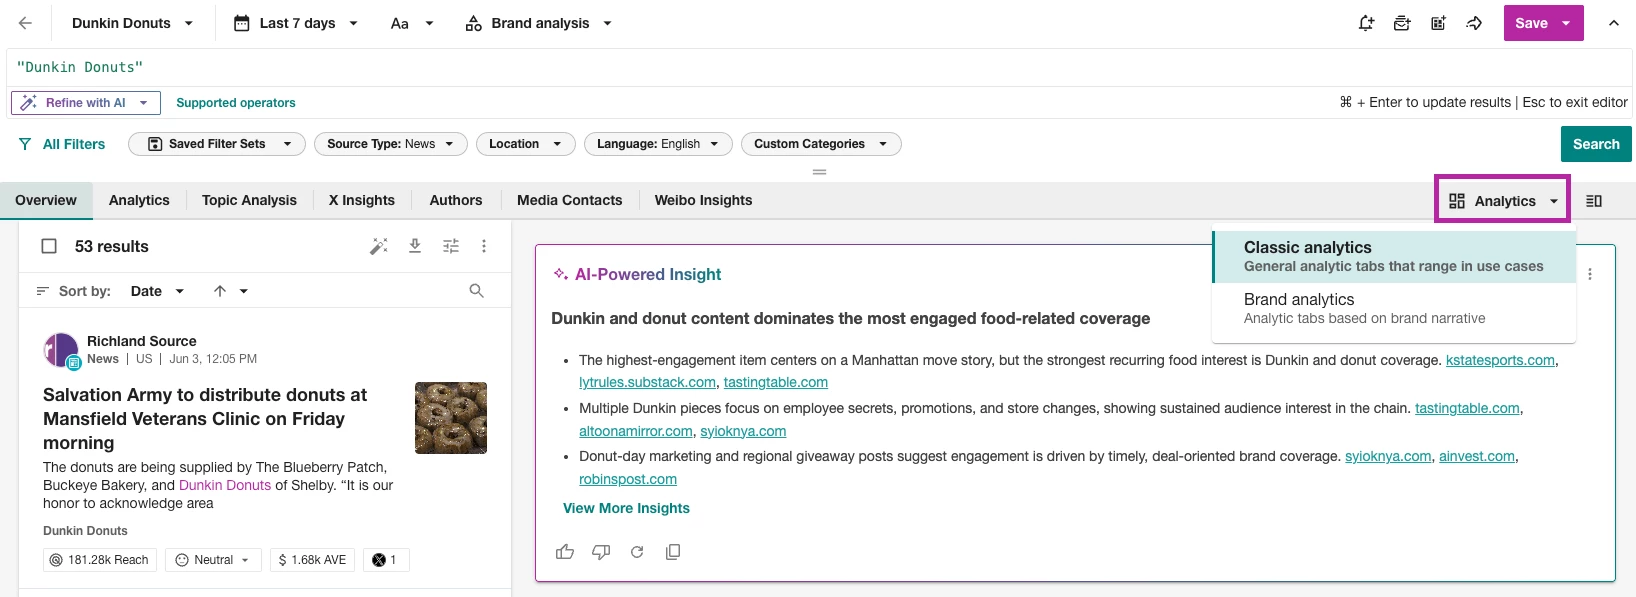
- Click the arrow in the top right-hand corner
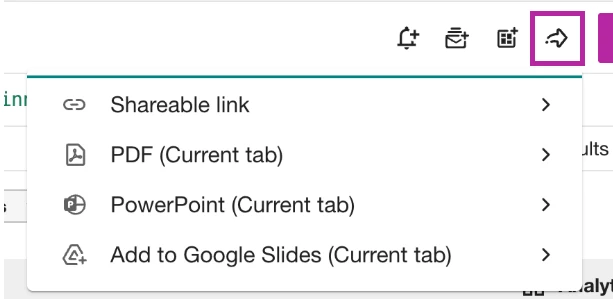
- For a Shareable Link
- Click Shareable Link
- Click Copy Invitation
- Paste your invitation where you want to share the link
- For a PDF
- Click PDF
- Select Download Report
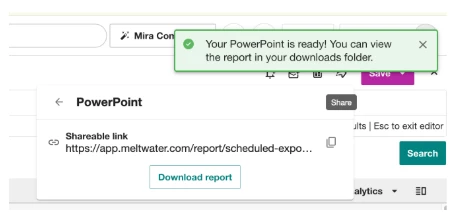
- For a PowerPoint
- Select PowerPoint
- Click Download Report
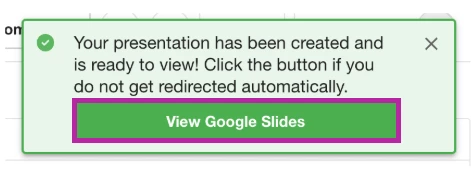
- When your PowerPoint is ready, you will see a green status notification
- For a Google Slide
- Select Google Slide
- Choose a Google Drive account to connect
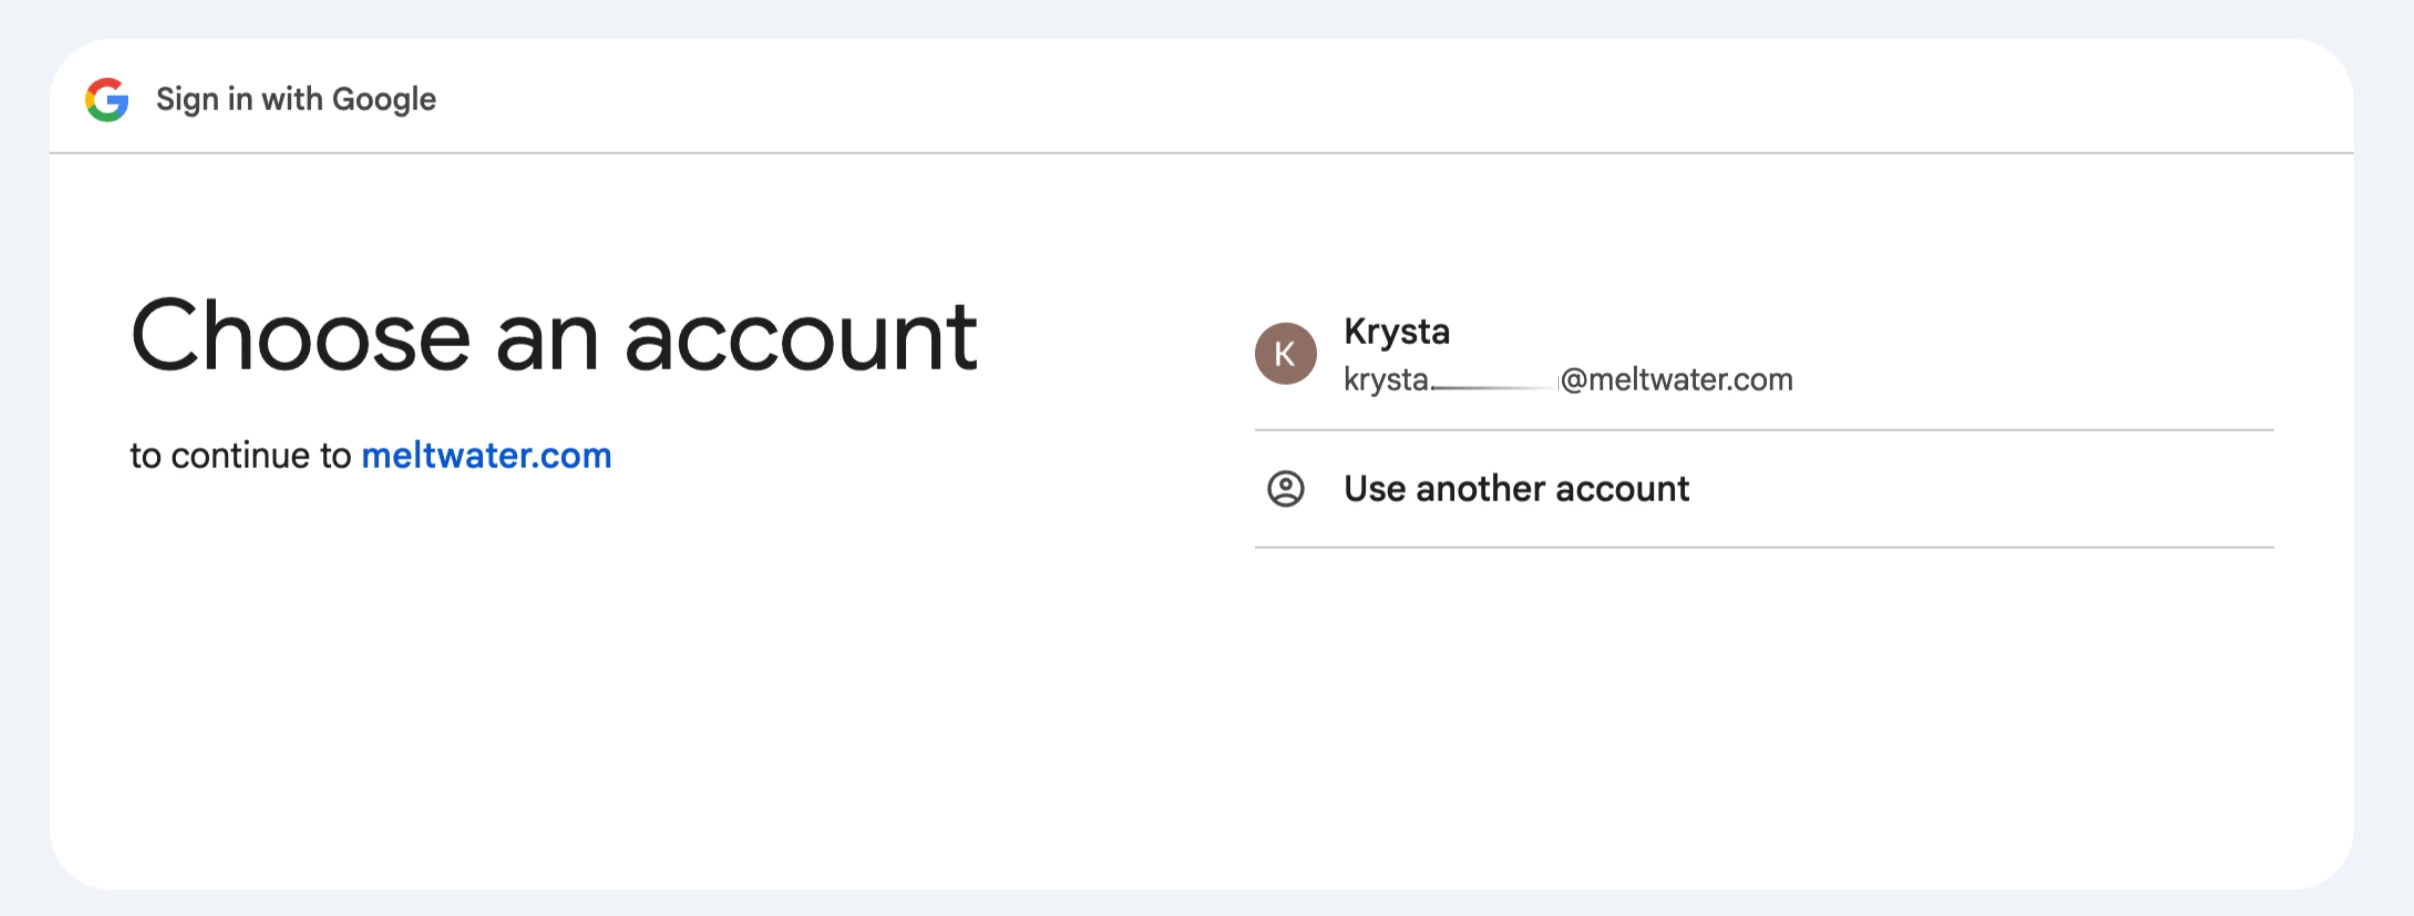
- Click Continue to grant permission to meltwater.com
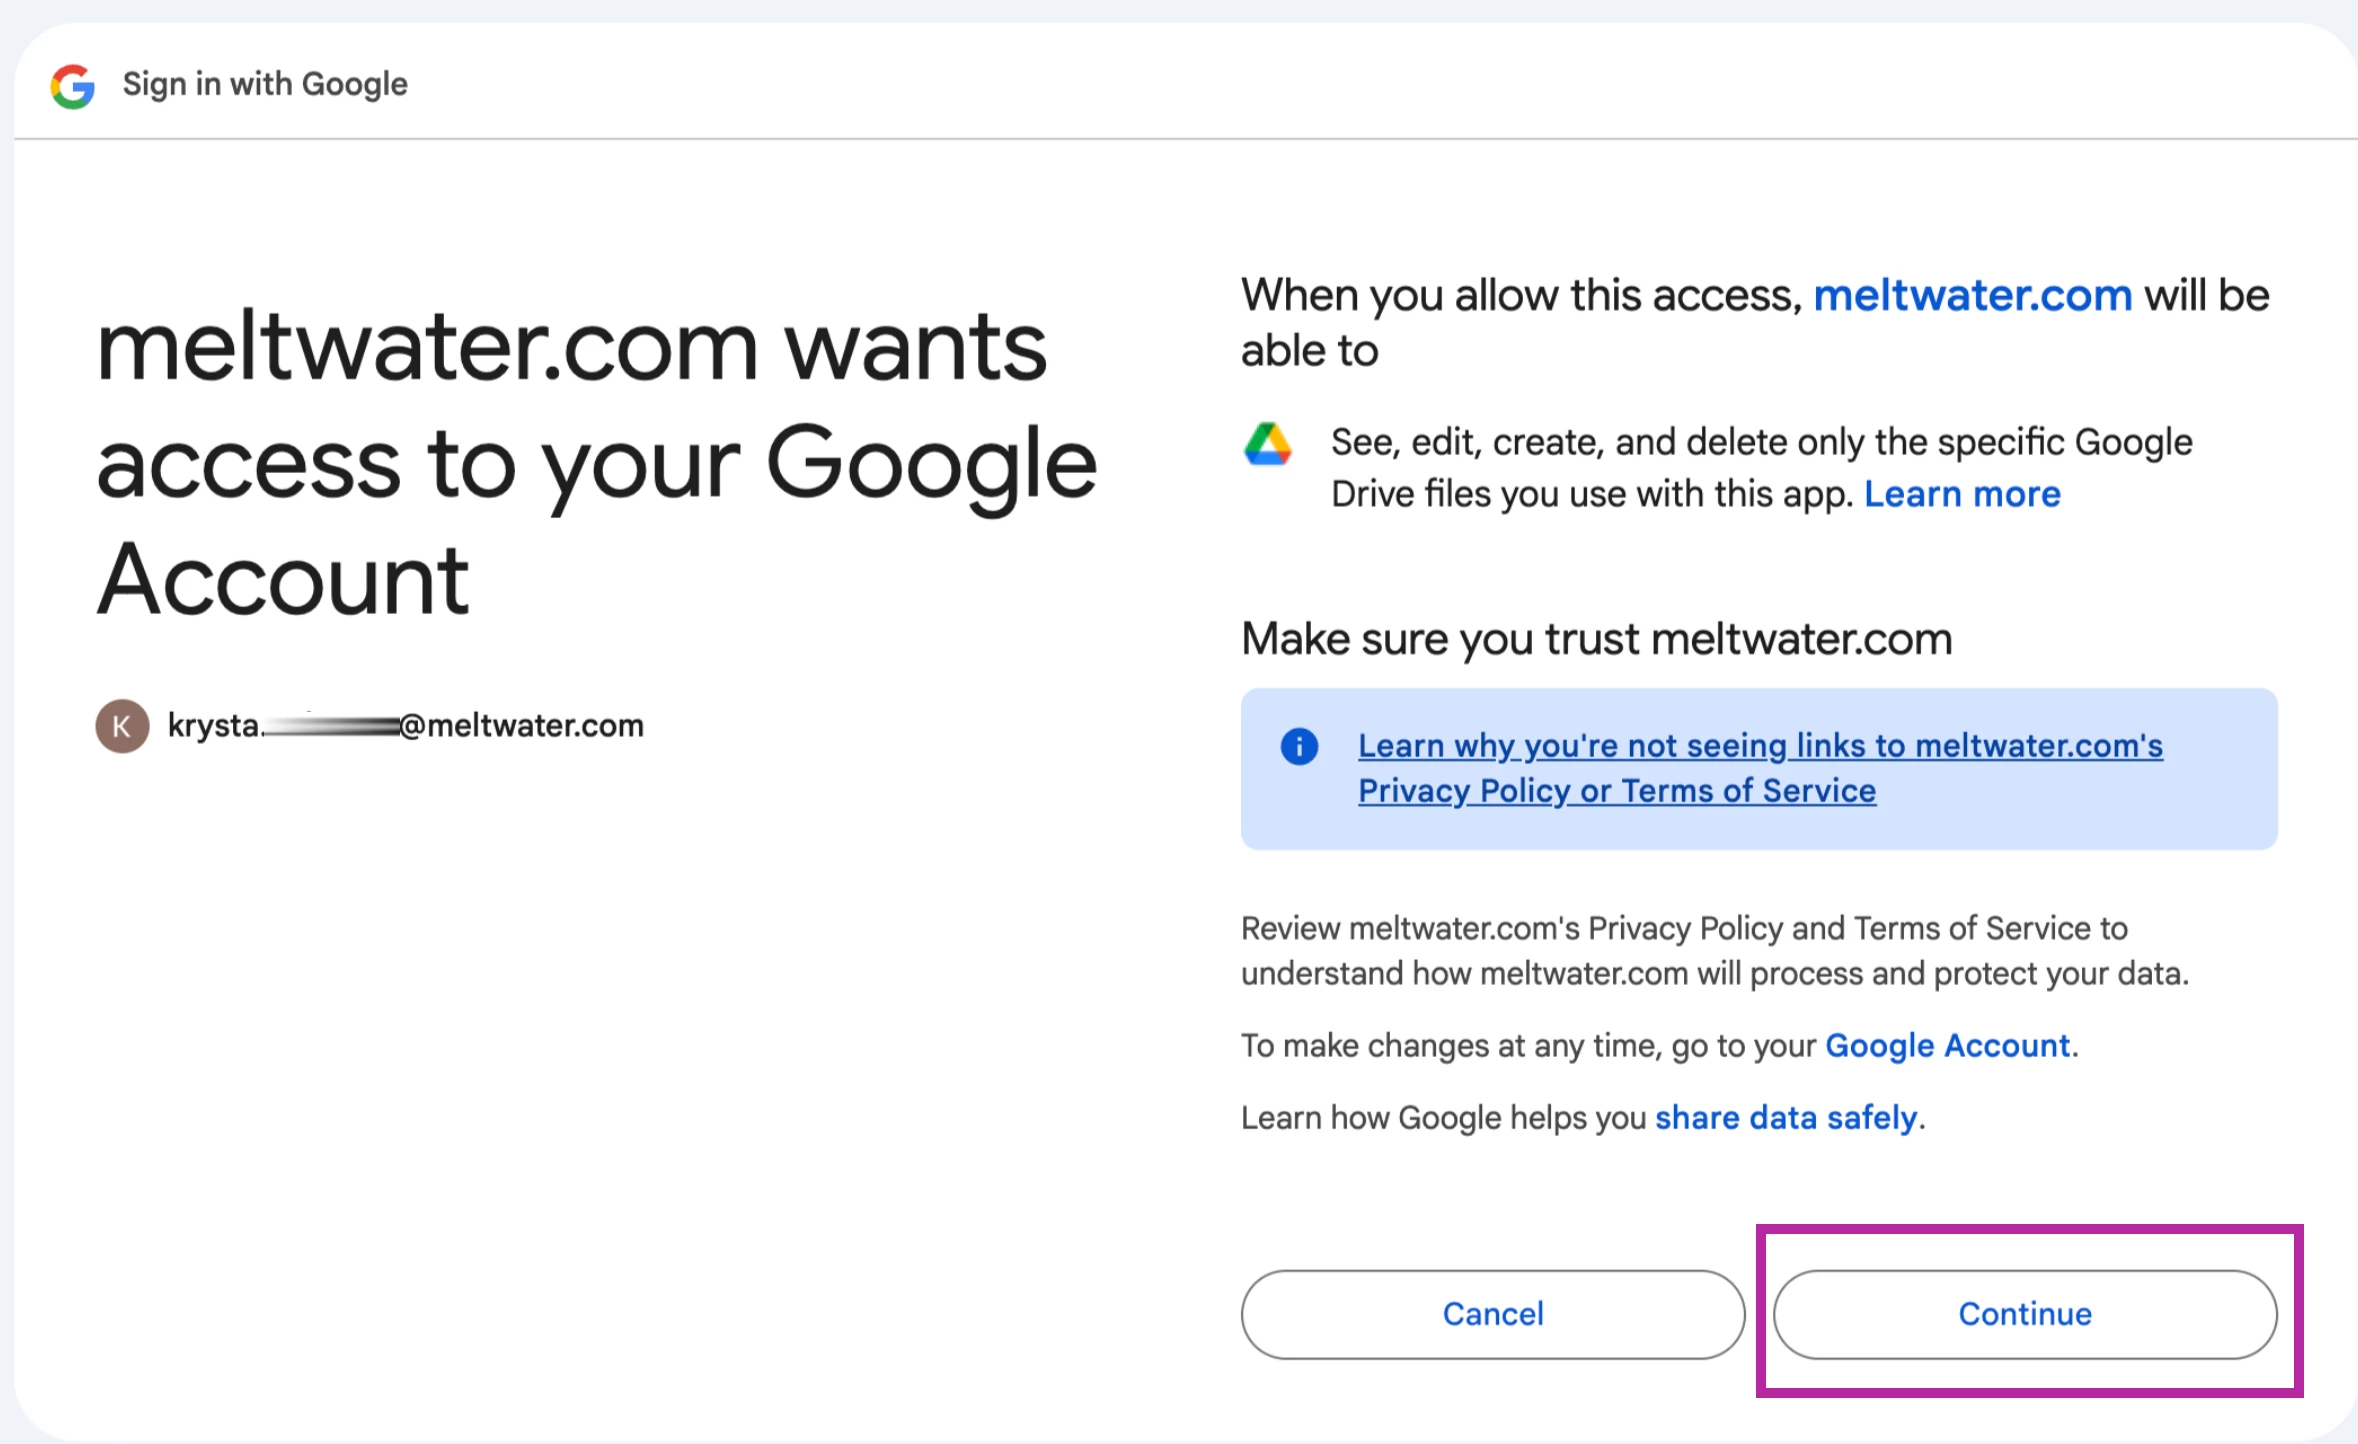
- Select View Google Slides to open a new tab with your Google Slide presentation
Saving Searches
Once you’ve created a new search and added all the necessary filters, you can save it by following these steps:
-
Select Save in the top right-hand corner
-
Click Save as
Note: Once a search has been saved and you edit it, click Save to ensure all changes have been saved.
-
Enter a search name
-
Add the search to a label (optional)
-
Click Save
Your search is now saved and listed under All Searches (below) and in the Explore home page.
Vetting Contacts & X (formerly Twitter) Authors
Easily vet and gather info on journalists while in Explore. The same journalist mini-profiles featured in Media Relations and Monitor are now available in Explore for all users.
To view the mini-profile:
-
Click on a journalist's name in the content stream.
-
A condensed profile will slide onto the right-hand side of the screen for the contact. You will not be taken away from your current screen.
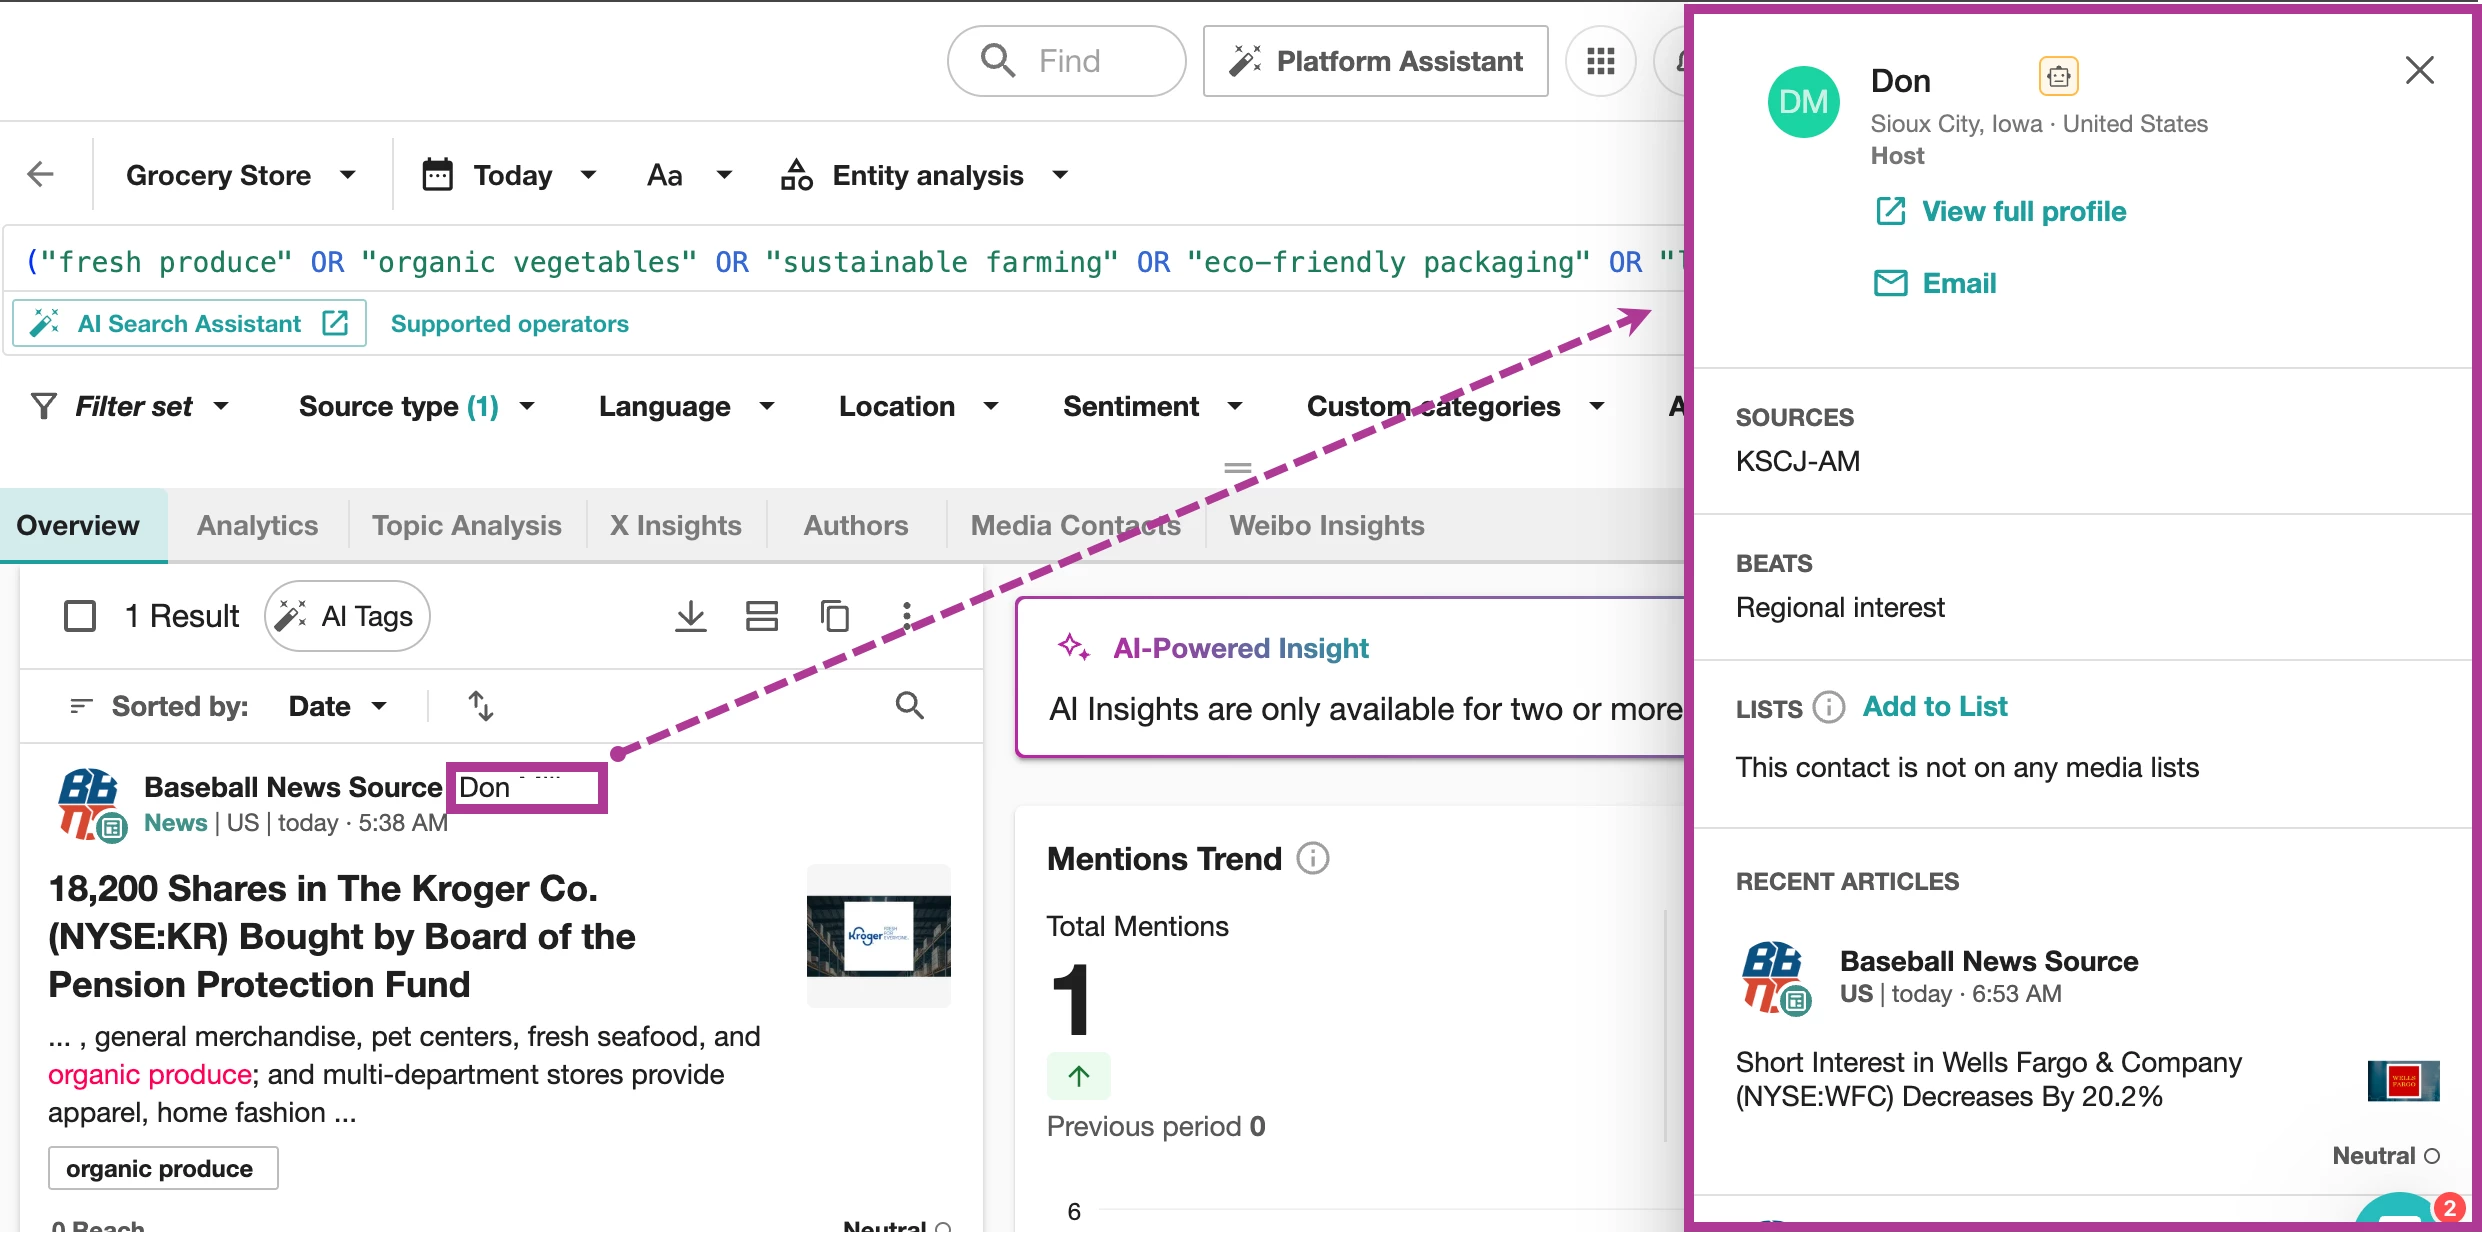
In the mini-profile, you will see the following details:
-
Name and location
-
Sources
-
Beats
-
Lists
-
Recent Articles
-
Social Media
-
Contact Information
Journalist profiles can be accessed via the Overview, Analytics, Topic Analysis, and Media Contacts tabs in Explore.
There is also a link to view the full profile for this contact, which will open in a new tab.
Note: that you must have access to Media Relations in Meltwater in order to view the full journalist profile.
Sending Widgets to a Dashboard from Explore, Explore+, or Another Dashboard
In Analyze, Unified Dashboards (UDS) are Meltwater's next-generation reporting solution, replacing Legacy Analyze dashboards. Legacy dashboards cover earned media only. UDS combines paid, earned, and owned media into a single interactive experience offering deeper customization, AI-assisted insights, and broader sharing capabilities.
Legacy vs. Unified: What's Different
| Feature | Legacy Dashboards | Unified Dashboards (UDS) |
| Data Coverage | Earned media only | Paid, earned, and owned media |
| Available Templates
| Brand Report, Benchmark Report, Campaign Report, Coverage Report, Earned Media Measurement Report | Brand, Benchmark, Campaign, Audience, Earned Media Measurement, Crisis Management, Facebook Overview, Instagram Overview, LinkedIn Overview, X Overview, YouTube Overview, TikTok Overview, Coverage Report More to come! |
| Customization
| Limited filters, views, and widget customization Available Filters: Source Type, Language, Location, Sentiment | Fully customizable widgets, layouts, and date ranges
All filters available (main filters, text analysis, image recognition, mentions origin, authors, custom categories)
|
| Analysis Depth | Single-metric focus | Multi-metric comparisons (up to 10 Standard Searches or 60 Optimized Searches)
|
| AI Capabilities
| Not available | AI-assisted insights widgets that are editable. |
| Sharing | Restricted | Live dashboards for non-users + interactive views Sharing Options:
|
| Organization
| Basic | Workspaces and folder-level governance
|
Build dashboards faster with ready-made templates. Start instantly with pre-built templates designed for real use cases. Role-based organization helps you quickly find the right social performance dashboard — no guesswork, no starting from scratch.
Customize dashboards to fit your exact goals. Choose the metrics and visualizations that matter most to you. Flexible widgets give you full control to tailor every dashboard to your specific needs.
Get deeper insights without extra work. Combine multiple data views in one place, apply filters instantly, and uncover connections between metrics — no need to run multiple searches.
Turn data into clear next steps with AI. AI-powered widgets explain what happened, identify why it happened, and recommend what to do next — so you can act faster and with confidence.
Share insights with anyone, instantly. Create live, shareable dashboards that keep everyone aligned — even stakeholders without Meltwater access.
Stay organized and in control. Use structured workspaces and folder-level permissions to manage access, maintain consistency, and keep dashboards easy to navigate.
Why It Matters
- Full media coverage. Track performance across all channels in one place, not just earned.
- Flexible dashboards. Build views that match your goals with custom widgets, filters, and layouts.
- Faster insights with AI. AI-assisted widgets surface what's happening and why, so you spend less time digging.
- Easier sharing. Send live dashboards to stakeholders inside or outside Meltwater.
- Scalable organization. Manage dashboards across teams, campaigns, or clients with workspaces and folders.
New Insights Available in UDS
UDS introduces a significantly expanded set of widgets covering sentiment, audience, reach, engagement, and performance. Below is the full list of available insights:
AI Widgets
- AI Audience Analysis (available for Optimized Searches)
- AI General Analysis
- AI Positive and Negative Analysis
- AI-Powered Clusters
- AI Pulse Analysis (available for Optimized Searches)
- AI Risk Analysis (available for Optimized Searches)
- AI Summary: Most Frequent Topics
Mentions & Reach
- Top Mentions
- Mentions and Reach Trend,
- Mentions and Engagement Trend
- Mentions and AVE Trend
- Mentions Performance
- Total Mentions Trend by Source Type
- Total Mentions Trend by News Media Type
- Source Type Performance
- Most Engaging Mentions
Engagement
- Most Frequent @ Mentions
- Emerging @ Mentions
- Engaging Pictures & Videos
- Total Engagement Trend by Source Type
- Average Engagement Per Mention
Sentiment
- Total Average Sentiment
- Share of Voice by Sentiment
- Top Keyword Sentiment
- Share of Voice by Total Sentiment
- Total Sentiment Trend
- Sentiment Performance
- Emotion
- Emojis
- Top Sources by Sentiment
Audience & Authors
- Top Authors
- Top Sources
- Share of Voice by Total Source Type
- Share of Voice by Media Type
- Author's Gender
- Author's Demographic
- Author's Occupations
- AI Audience Analysis
Reach & Visibility
- Mentions and Estimated Views Trend
- Share of Voice by Reach
- AVE by News Media Type
- Total Editorial Reach
Location
- Top Locations - Countries
- Top Locations - Regions
- Top Locations - Cities
- Share of Voice by Top Locations
Reviews
- Review Rating
Migration Tooling: What It Does and What to Expect
Migration tooling is provided as a time-saving utility to help recreate existing Analyze dashboards in the new Unified Dashboard experience. The tooling recreates your existing dashboards as closely as possible, but due to differences in the underlying technologies, a perfect 1:1 migration will not be possible in every case.
Your existing Analyze dashboards will not be deleted or hidden when upgraded. You can continue to reference them during your transition.
What the Tooling Will Do
- Make a best-effort conversion of widget layout from Analyze to UDS
- Maintain existing tab structure within dashboards
- Attempt to convert text widgets used as headers into title rows (based on positional data)
- Convert slide layouts into a regular dashboard while preserving layout within the row-based system
What the Tooling Will Not Do
- Convert cover slides (text and image widgets within cover slides will not be migrated; any analytic widgets will be included)
- Automatically migrate scheduled reports (see Scheduled Reports below)
Migration: Layout Considerations
Unified Dashboards use a row-based layout system, which differs from the fully customizable grid system and slide layout system in Legacy Analyze.
Row limit: UDS has a hard limit of 15 rows per tab. Some Analyze dashboards may exceed this depending on widget count and layout. When this happens, the tooling will create additional tabs to hold overflow content.
Migration: Widget Behavior
While there is generally good overlap between the widgets available in both systems, underlying configurations differ. Some configuration values may not migrate properly, and some widgets may require manual adjustment.
Chart Type Changes
Some chart types in Legacy Analyze do not exist in UDS. The tooling will select a roughly equivalent chart. You can change the chart type in UDS after migration.
- Column charts will be converted to bar charts.
Data Discrepancies
Data may differ slightly between Legacy Analyze and UDS. The goal is parity, but variations in how certain metrics are calculated (e.g., reach, engagement) may produce minor differences.
Share of Voice Input Limits
Legacy Analyze SOV widgets allowed up to 25 inputs. UDS does not currently support the same number. In most cases, the tooling will create the widget, but it may not render data correctly and will display an error message instead. You will need to manually reduce the inputs in these widgets.
Automatic Upgrades
The tooling will make a few explicit upgrade decisions:
- Big Number widgets (e.g., total mentions) will be upgraded to the new KPI style with a sparkline automatically included.
- Article widgets (Highest Potential Editorial Reach, Highest Syndication, Most Social Shares) will be replaced with Top Mentions widgets using different sort orders.
- Top Source/Publication widgets will use the new table layout, which displays richer metrics than the Legacy bar charts.
Incompatible Widgets
If an error occurs during migration, the tooling will create a text widget with the original widget's title and an error message. In some cases, a card may not render in UDS and will appear as a blank spot in view mode (or a blank card in edit mode).
The following widgets are known to be incompatible or have different versions in UDS. Use the recommended alternatives:
| Legacy Widget | UDS Alternative |
|---|---|
| Content Stream | Top Mentions, Featured Mentions, or the full content stream in the right panel (click a data point or "view all content") |
| Top Locations with Sentiment | Top Sources by Sentiment (change first attribute from Sources to Sentiment) |
| Top Organizations | Top Entities |
| Top Organizations and Share of Voice | Top Entities, switch to table bar chart |
| Highest Potential Editorial Reach | Top Mentions, sort by Reach |
| Most Social Shares | Top Mentions, sort by Social Echo |
| Highest Syndication | Does not exist in UDS. No similar option. |
Migration: Scheduled Reports
Scheduled reports will not be automatically migrated. Because migrated dashboards may need review and adjustment to meet your expectations, report schedules should be recreated manually after you have reviewed and finalized your migrated dashboards.
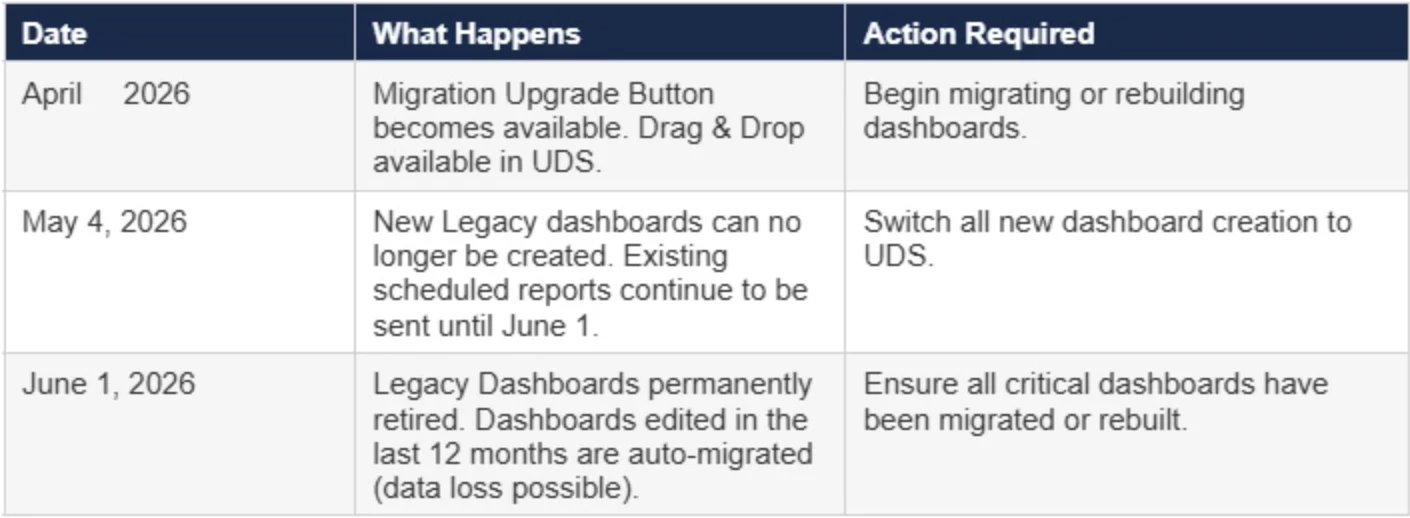
Legacy Dashboards retire June 1, 2026. After that date, they will no longer be accessible. Start your transition now using the Migration Playbook.
What You Need to Know
On June 1, 2026, Legacy Dashboards in Analyze will be sunset and upgraded to the Unified Dashboards (UDS) experience.
After this change, dashboards created in the Legacy Analyze experience will no longer be accessible and will be recreated as a Unified Dashboard (data could be lost).
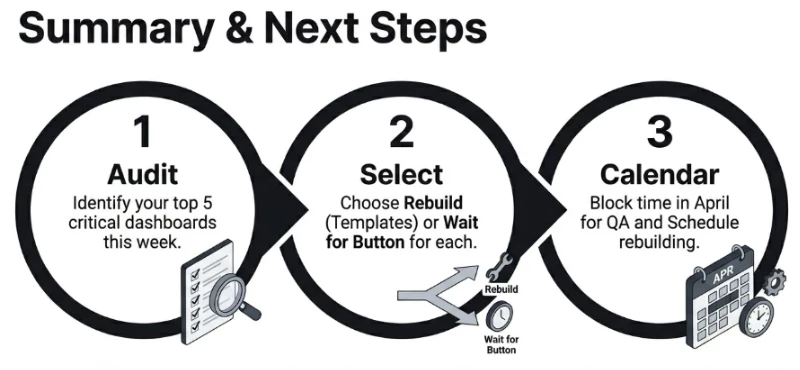
To avoid losing access to dashboards you rely on, you’ll need to do one of the following before June 1, 2026:
-
Rebuild your key Legacy dashboards in Unified Dashboards , using UDS templates or a custom dashboard.
-
Upgrade your Legacy dashboards using the Migration Upgrade Button, then review and finalize the migrated version. (button will be available late April)
-
Do nothing, dashboards that have been edited in the last 12 months will be automatically moved over (but some data could be lost)
Have Questions?
Listen to our Migrating to Unified Dashboard Workshop recording. We will offer another workshop in May. Follow this post (below) to be notified of the next session.
Comment below or join our next Office hours.
Key dates
This Guide covers:
Why This Is Happening
We have upgraded the technology behind Analyze. Unified Dashboards in Analyze is Meltwater’s modern way to bring all your media intelligence into one flexible dashboard. This helps you track, analyze, and share insights without switching between multiple reporting tools.
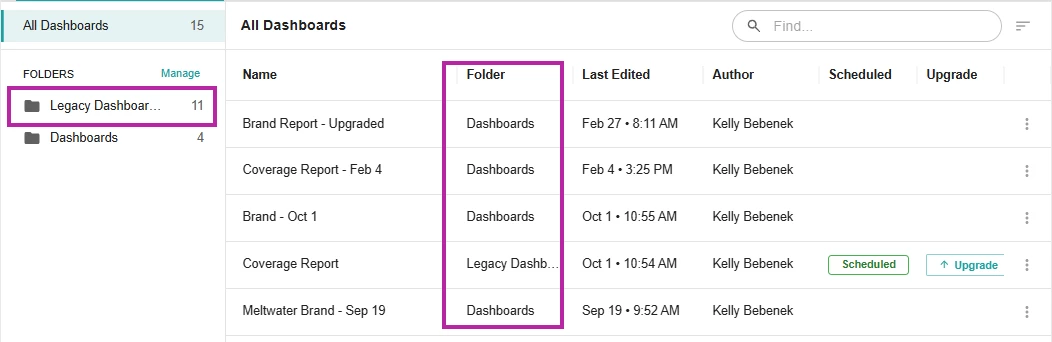
How to Identify Legacy Dashboards
Navigate to Analyze, on the Home Page you will see a Table (screenshot below)
If you have a Legacy Dashboard you will see a folder titled Legacy Dashboards.
Key Differences: Unified Dashboards vs. Legacy Dashboards
This post covers what's changing between Legacy and Unified Dashboards, the full list of UDS widgets, and what to expect from the migration tooling.
Your Migration Options
You have three paths forward. Choose the one that best fits your situation.
Option A: Do nothing (Auto-Migration)
Any legacy dashboards that were edited in the last 12 months will be automatically migrated on June 1. However, UDS is not a 1:1 match with Legacy, so some data will be lost during auto-migration.
Important: Delete any legacy dashboards you no longer need before June 1 or they will be migrated over.
Option B: Build a New UDS Dashboard (Recommended)
Building a new Unified Dashboard is often faster and cleaner than migrating. It avoids formatting issues introduced by the migration tool and gives you a predictable, polished result.
Why this is recommended
- Templates are built on best practices and popular widgets
- You avoid layout conversion issues and most migration cleanup
- You get a dashboard aligned with the experience being improved going forward
Types of Unified Dashboards you can create
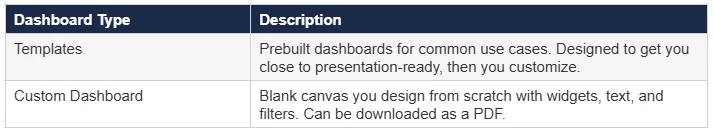
How to Build a Unified Dashboard
🎥How to Create a Dashboard from a Template
🎥How to Create a Custom Dashboard
Option C: Use the Migration “Update Button” Available Late April
The Migration Tool recreates your Legacy dashboards in the new UDS experience. It gets you approximately 70–80% of the way to a finished dashboard. A perfect 1:1 migration is not possible because the two systems use different underlying technology.
Best for
- Customers with a high volume of dashboards that need to be migrated
What to expect
- The tool provides a best-effort layout conversion
- Plan time to review layout, widget compatibility, and reporting expectations
- Migrating does not delete or hide your existing Legacy dashboard – it is safe to test and compare
Migration Tool: What It Does and Does Not Do
The Upgrade Button will
- Convert widget layout using best-effort matching to comparable UDS widgets
- Maintain existing tab structure
- Attempt to convert text widgets used as headers into title rows
- Convert slide dashboards into standard dashboards while trying to preserve layout
The Upgrade Button will not
- Convert cover slides
- Migrate text and image widgets within cover slides (analytic widgets are still included)
-
Carry over scheduled report schedules – these must be recreated manually
See the full breakdown.
Post Migration Checklist
Use this checklist before sharing your upgraded dashboards broadly.
-
Confirm layout and tab structure
- Validate tabs and the overall flow
- If migrated, rearrange widgets to match your preferred story
- Watch for the 15 rows per tab limit
-
Quality check widgets and charts
- Check for chart substitutions (example: column to bar)
- Confirm upgraded/replaced widgets still meet expectations (KPI, Top Mentions, new tables)
- Look for migration errors (text widgets with error messages) or blank cards
-
Replace unsupported widgets
- Swap incompatible widgets with a supported UDS alternative
- Reconfigure settings as needed
-
Recreate scheduled reports
- Scheduled reports do not upgrade automatically
- Rebuild schedules only after dashboard quality assessment is complete
-
Validate reporting confidence
- Confirm searches, filters, and date ranges
- Spot-check key metrics against your Legacy dashboard
- Confirm the dashboard tells the story you intend
- Only share with leadership or clients after validation is complete
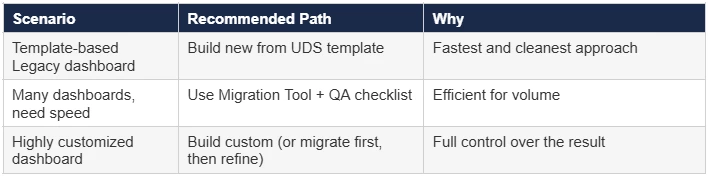
How to Choose Your Migration Path
Frequently Asked Questions